IoT — Data visualization
Author
KalleDate Published

After collecting data the next step is to use this information. And one of the best ways to do so is paint beautiful graphs based on the numbers. There are many tools to support you like kibana or grafana which are both open source software and capable to display large amounts of data coming from live streams. If you want to get your hands a bit dirty you can also go for one of the bazillion javascript frameworks. Both ways have benefits and drawbacks, for larger projects with possibly huge datasets, kibana and co. are the way to go. Those tools come with query languages to generate graphs from data stores like elastic search, are battle tested in big data environments and basically industry standard, so support and general knowledgebase is great. The drawbacks are a more complicated setup and hosting than a browser based javascript solution. In principle, with each solution path you have to decide what data you want to display and how you want to display it.
For this project or comparably sized ones I recommend setting up a custom visualization with javascript to save the effort of hosting another data storing solution and a dedicated visualization service. If you already have a complete kibana/grafana or comparable setup this is another story, then you should just add your project to the existing setup. If not the hosting of a static web app is pretty easy, even firebase has a hosting solution included.
So the first step is to install the firebase-tools as a global package to control your firebase projects from the terminal.
Then use create-react-app to bootstrap a new react based web application. Run the following command to create a new folder (APP_NAME) containing the code for the application:
When the initialization process is complete you can start a development server to start working on the web app with the command npm start run in the project folder. With the command npm run build you can create an optimized build to serve over the internet.
To publish the web site to firebase start by signing in with the command firebase login and continue with firebase init. During the init process you have to make some choices:
- Which Firebase CLI features do you want to setup for this folder?: Hosting
- What do you want to use as your public directory? build
- Configure as a single-page app (rewrite all urls to /index.html)? yes
With firebase initialized you can now run firebase deploy to publish your application, remember to run npm run build to have a freshly built version in the build folder.
When you got familiar with the basic project setup you need to install two more dependencies: [@firebase/app](https://www.npmjs.com/package/firebase) and [recharts](https://www.npmjs.com/package/recharts). The firebase package let's you connect to firebase and access your data, the recharts package provides composable react-components to build up charts and graphs.
To connect to your firestore instance start by initializing the firebase app and then get the reference to the firestore:
With the working firestore reference you can now query data by using the firestore API:
But when you call this function and try to read data you will get this error:
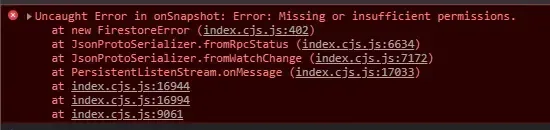
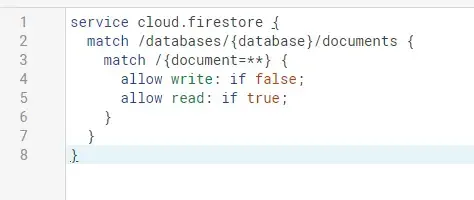
This means that you have to configure the rules of the database so that reads are allowed. To change the rules go to the database settings in the firebase console and choose the rules tab. The following ruleset will allow all reads and deny writes without admin access.
Now after allowing reads, the next step is to connect the firebase data with the actual app. A React component extending the Component class can hold an instance state object which will trigger a re-render whenever it gets updated by the setState method of the component. So this state is ideal to hold the graph data. To subscribe to the firestore updates and save the result in the instance state extend the App as follows:
The App component now has access to the stored sensorData and finally you can start to render a chart with it. The library Recharts provides a lot of functionality and you should definitely have a look into the documentation recharts.org
Here is an example of a line-chart displaying the temperature over the date:
Tasks
- choose fitting charts to display the temperature and humidity values
- deploy your chart(s) to firebase

IoT — Building an automated greenhouse Pt. I
Start building an automated greenhouse using a Raspberry Pi, sensors, and an analog-digital converter. This guide covers setting up the hardware, enabling SPI, connecting a soil moisture sensor, and writing a Node.js program to read and send sensor data to the cloud.
Mailing List
If you want to receive updates on new posts, leave your email below.